
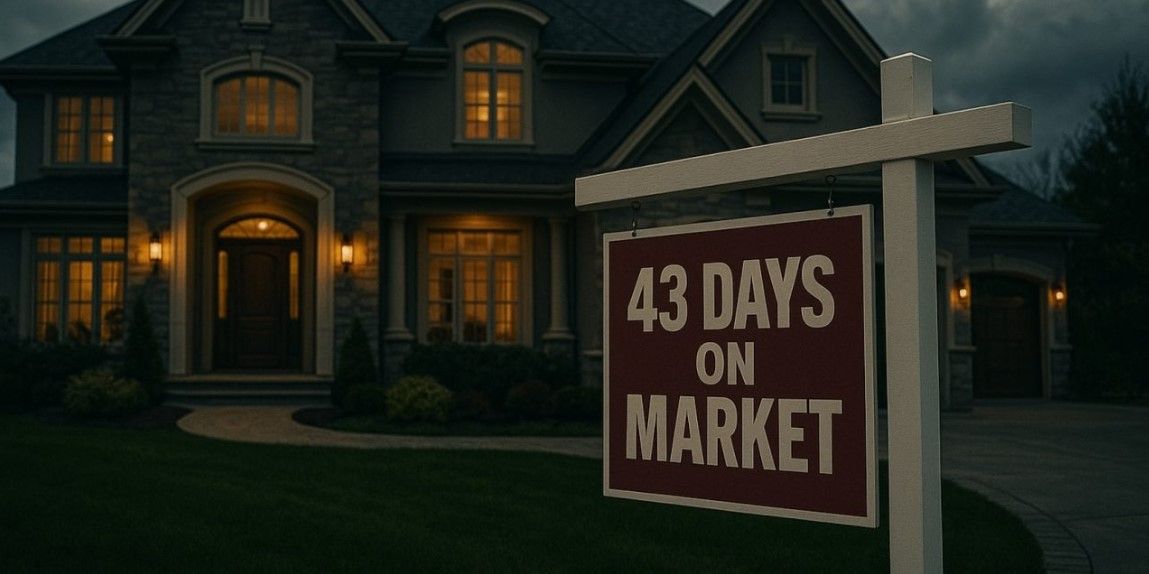
Homes Now Taking 43 Days to Sell, Marking the Slowest Summer in a Decade
Check Out This Weeks Newsletter
The U.S. housing market has slowed. According to Redfin’s latest report, the typical home that went under contract in July sat on the market for 43 days.
That’s up from 35 days a year earlier. And it’s the longest July span since 2015.
This cooling pace reflects a mix of high homebuying costs, economic uncertainty, and a shift in seller behavior. Pending sales have fallen to a two-year low, and active listings just posted their largest monthly drop since 2023.
Here’s what you need to know about the national trends, where supply and demand are headed, and how market dynamics are playing out at the metro level.
For context and a full breakdown of Redfin’s report, tune in for today’s Hot Sheet with Byron Lazine:
Homes Are Taking Longer to Sell
Homes are sitting longer as buyers pull back. Pending sales fell 1.1% month over month in July, dropping to the lowest seasonally adjusted level since November 2023.
Existing-home sales slipped to a seasonally adjusted annual rate of 4.15 million, the lowest in nearly a year.
At the same time, total homes for sale remain high compared to recent years, even though active listings fell 1% from June to 1.92 million. That decline marked the steepest monthly drop in nearly two years.
New listings also fell slightly, down 0.4% from June to the lowest level since March 2024.
As Redfin Senior Economist Asad Khan explained:
“Supply is starting to fall because prospective sellers are choosing not to list after seeing their neighbor’s home linger on the market or sell for below the asking price. Some existing sellers are also pulling their homes off the market, opting instead to rent their house out or hold off on a move altogether, especially if they bought at the peak of the pandemic market and are worried about taking a loss.”
Prices Are Rising Despite Slower Demand
Even with weaker sales activity, prices are climbing again. The median home sale price rose 1.4% year over year in July to $443,867, the highest July level on record.
For context, prices grew just 0.9% in June and 0.7% in May. Month over month, the median price dipped 0.6%, but overall, the trend shows that shrinking supply is pushing prices upward.
For buyers, mortgage rates are offering a small silver lining. The average 30-year fixed rate dropped to 6.58% in late July after peaking at 6.75% earlier in the month. On a monthly basis, the average mortgage rate was 6.72%, slightly lower than the previous month and down 0.13 percentage points from a year earlier.
Buyer Competition Is Still Weak
One of the clearest signs of a softer market is pricing power. The typical home sold in July went for about 1% below asking price, the biggest July discount since 2020. Only 28.9% of homes sold above the list price, the lowest July share since 2019.
The average sale-to-list ratio dropped to 99%, down from 99.6% a year earlier.
Meanwhile, canceled deals are on the rise. Roughly 58,000 home-purchase agreements fell through in July, equal to 15.3% of pending sales. That’s the highest July cancellation rate in Redfin’s records, which go back to 2017.
Metro-Level Trends
The slowdown is not evenly distributed. Metro-level data shows sharp differences depending on location. That checks out with Zillow’s latest report showing home values rising in half of all major U.S. metros, while they drop in the other half.
Price changes (YoY):
- Biggest gains: Cleveland (+12.8%), Nassau County, NY (+7.1%), Indianapolis (+7.1%)
- Biggest declines: Oakland, CA (-6.1%), Jacksonville, FL (-3.9%), West Palm Beach, FL (-3.8%)
Pending sales (YoY):
- Largest increases: Phoenix (+11.2%), Austin (+6.8%), Houston (+6.1%)
- Largest declines: Portland, OR (-12.6%), Miami (-11.8%), Tampa, FL (-11.7%)
Closed sales (YoY):
- Largest increases: Houston (+4.8%), Virginia Beach (+3.7%), San Francisco (+3.2%)
- Largest declines: Miami (-20.2%), San Antonio (-15.3%), San Jose, CA (-10.1%)
Active listings (YoY):
- Largest increases: Las Vegas (+28.4%), Houston (+25.5%), Dallas (+23.6%)
- Declines: San Francisco (-11.2%), Nassau County, NY (-4.4%), Portland, OR (-1%), Kansas City, MO (-0.9%)
These figures highlight just how fragmented today’s market has become. In some metros, inventory and sales are rising, while in others, both buyers and sellers are stepping back.
Agent Takeaways
For real estate professionals, Redfin’s report points to a market where clear communication and local expertise matter more than ever.
Here are three takeaways you can share with clients and your community:
- Homes are taking longer to sell. With the national median at 43 days, buyers have more breathing room, and sellers need to set realistic expectations about timelines.
- Pricing power has shifted. The average home is selling below list price, and competition has cooled. Agents can use this data to help buyers negotiate and remind sellers of the importance of fair pricing.
- Local trends vary widely. National data shows one story, but metro-level numbers highlight a patchwork market. Use local stats in your conversations to show clients how their area compares.
The bottom line: Buyers and sellers are both in wait-and-see mode, creating a slower, less competitive market.
Key Details:
- In July, Redfin reports the typical U.S. home sat 43 days on market, up from 35 a year earlier and the longest July span since 2015.
- Pending sales fell 1.1% to 470,474, while active listings dropped 1% to 1.92 million.
- The median sale price rose 1.4% year over year to $443,867, even as 15.3% of pending deals were canceled.
Sarah Lentz | Aug 20, 2025 | Housing Market
https://nowbam.com/homes-now-taking-43-days-to-sell-marking-the-slowest-summer-in-a-decade/
@ChuckBarberini - #ChuckBarberiniRealEstate - @ChuckBarberiniRealEstate
Categories
Recent Posts