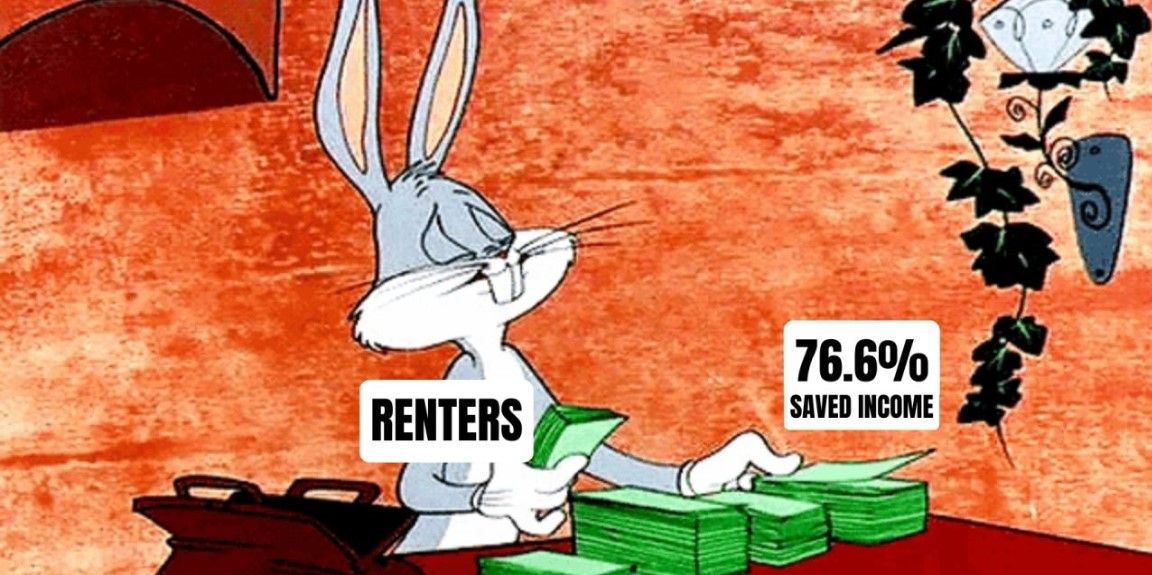
Renters Now Spend Less than 24% of Income on Rent
In its latest September Rent Report, Realtor.com found that the typical U.S. household now spends less than a quarter of its income on rent for the first time in two years.
It’s a milestone that marks the 26th consecutive annual decline in rents and a rare stretch of good news for Americans who’ve been feeling the squeeze of housing costs on all fronts.

The median asking rent for 0–2 bedroom units across the 50 largest metros dropped to $1,703 in September, down 2.1% year over year and $10 month over month. That puts rents $56 below their August 2022 peak, though they remain 16.5% higher than before the pandemic.
Rent growth has been muted throughout 2025, with asking prices up just 0.4% year to date, compared with 1.9% over the same period in 2024.
For renters, that moderation is starting to add up to something meaningful.
Danielle Hale, Chief Economist at Realtor.com, summed it up best.
“Two years of gradual rent declines have given renters a bit more breathing room. Still, even as a typical household spends a smaller share of income on rent than a year ago, affordability remains stretched in major markets, particularly along the coasts.”
A Small Win for Renters Nationwide
The typical renter household spent 23.4% of its income on rent in September, down from 24.9% a year earlier. That shift reflects modest rent declines combined with steady income growth, helping improve affordability in most U.S. markets.
Across unit types, rents fell across the board:
- 1-bedroom units: $1,582 (down 2.3%)
- 2-bedroom units: $1,885 (down 2.2%)
- Studios: $1,426 (down 1.0%)
Even with those declines, affordability still varies widely by region.
The Most and Least Affordable Metros
Miami topped the list of least affordable markets, where typical renters spent 37.1% of their income on rent. Rounding out the top five:
- Los Angeles (37.0%)
- New York (36.7%)
- Boston (32.3%)
- San Diego (31.5%)
While each of these metros saw small improvements year over year, affordability remains strained for renters living along the coasts.
At the other end of the spectrum, Austin became the most affordable rental market in the country, with renters spending just 16.5% of their income on a typical lease. Next in line:
- Oklahoma City (16.9%)
- Raleigh (18.0%)
- Columbus (18.1%)
- Minneapolis (18.7%)
These metros also benefited from notable year-over-year improvements in affordability, led by markets with increasing rental supply and moderating demand.
Where Affordability Improved the Most
Six metros saw the biggest affordability gains compared with last year, according to Realtor.com’s analysis.
- Jacksonville, FL (down 3.5 percentage points to 21.5%)
- San Diego, CA (down 3.4 points to 31.5%)
- Miami, FL (down 3.3 points to 37.1%)
- Denver, CO (down 3.2 points to 19.8%)
- Austin, TX (down 2.8 points to 16.5%)
Markets in the South and West, particularly in Florida, Texas, and Arizona, are driving most of the improvement. Increased construction has helped relieve pressure on prices, giving renters more choices and slowing the pace of rent growth.
Jiayi Xu, Senior Economist at Realtor.com, said the new supply is playing a key role.
“More new rentals coming to market means renters have additional choices and a bit more leverage. Greater supply is allowing some renters to find homes that better fit their budgets, though affordability challenges persist in historically high-cost markets.”
Regional Trends and What to Watch
Rents declined the most in markets like Austin (-7.2%), Denver (-6.5%), and Phoenix (-6.4%), where supply has expanded fastest.
Meanwhile, more expensive metros such as Los Angeles, New York, and Boston saw smaller declines, and in some cases, prices that have barely moved.
Over the past six years, markets with the steepest rent growth include—
- Pittsburgh (+37.3%)
- Miami (+33.7%)
- Indianapolis (+32.1%)
- Tampa (+36.7%)
- Cleveland (+26.0%)
Even with short-term relief, these longer-term gains show how far prices have climbed since before the pandemic.
For real estate agents, these national and regional shifts matter. Rent data can influence client conversations around affordability, mobility, and housing demand.
When renters begin to see more breathing room in their budgets, they may start considering homeownership again. And in areas where rents continue to fall, investors and landlords may need to adjust pricing or incentives to stay competitive.
Affordability improvements are a positive sign, but they’re fragile.
Agents who track local rent trends alongside inventory and wage data will be best positioned to guide clients through the next market phase. That can mean preparing first-time buyers, advising landlords on pricing strategy, or helping renters navigate lease renewals as seasonal shifts take hold.
Key Details:
- Realtor.com reports the median U.S. asking rent fell to $1,703 in September, down 2.1% year over year.
- Typical renters now spend 23.4% of income on rent, compared with 24.9% a year ago.
- Austin is the most affordable market at 16.5% of income, while Miami remains the least affordable at 37.1%.
Sarah Lentz | Oct 14, 2025 | Housing Market
https://nowbam.com/renters-now-spend-less-than-24-of-income-on-rent/
If You Don’t Know - “Just Ask Chuck”
@ChuckBarberini #ChuckBarberiniRealEstate
#JustAskChuck @ChuckBarberiniRealEstate
https://dot.cards/chuckbarberini
Categories
Recent Posts


